Simulation Manager
Monitor multiple simulations and visualize the simulation data
Description
Simulation Manager allows you to monitor the status of multiple simulations. Using this tool, you can:
View the progress of the simulations in a high-level grid view or a detailed list view.
Find the simulations that error out and view diagnostics for each simulation.
Visualize simulation data to analyze the trends across the simulations.
Select a simulation run and open the model in Simulink®, with all of the simulation settings applied to the model.
View simulation results in the Simulation Data Inspector.
Abort simulations.
The Simulation Manager allows you to monitor multiple simulations, in serial or in parallel, and their progress. You can view the details of every run, such as parameters, elapsed time, and diagnostics. The Simulation Manager provides the option to analyze and compare your logged signal results in the Simulation Data Inspector. Through Simulation Manager, you can select a run and apply its values to the model.
With the command line API for running multiple simulations, for the parameter to show
up in plots in Simulation Manager use the setVariable method on the
Simulink.SimulationInput object.
Open the Simulation Manager
parsimandsimfunctions — Set the argumentShowSimulationManagertoonwhile usingSimulink.SimulationInputobject to run simulations. For more information, seeSimulink.SimulationInput.out = parsim(in, 'ShowSimulationManager', 'on')
out = sim(in, 'ShowSimulationManager', 'on')
To open a saved Simulation Manager session, navigate to the folder where the file is saved and double click the
.mldatxSimulation Manager file.open filename.mldatxTo open a Simulation Manager with the
Simulink.SimulationInputobject,in, and aSimulink.SimulationOutputobject,out, of a completed run, use theopenSimulationManagercommand.openSimulationManager(in, out)
Examples
Open Simulation Manager
Open the model sldemo_suspn_3dof and create a set of sweep
values.
mdl = 'sldemo_suspn_3dof';
openExample(mdl);
Cf_sweep = Cf*(0.05:0.1:0.95);
numSims = length(Cf_sweep);
To modify the block parameter Road-Suspension Interaction
with the sweep values, create an array of
Simulink.SimulationInput
objects.
in(1:numSims) = Simulink.SimulationInput(mdl);
for i = 1:numSims
    in(i) = setBlockParameter(in(i),[mdl '/Road-Suspension Interaction'],...
        'Cf', num2str(Cf_sweep(i)));
end
Run multiple simulations and open the Simulation Manager.
out = parsim(in, 'ShowSimulationManager', 'on')
In the absence of Parallel Computing Toolbox™, the simulations run in serial.
Using Simulation Manager
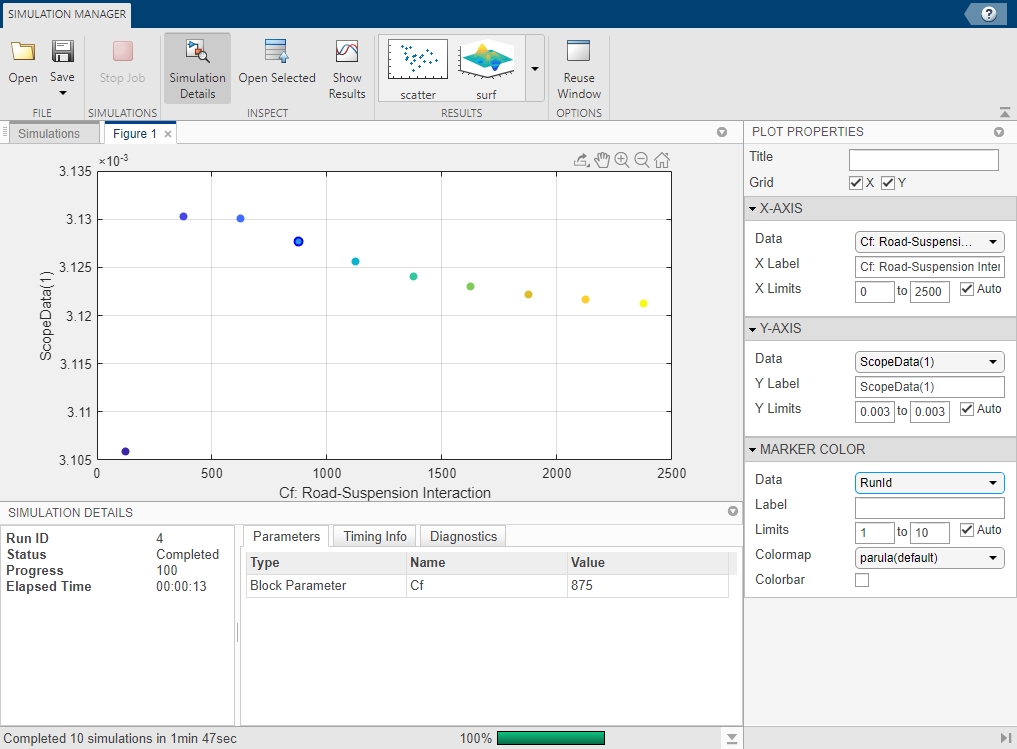
Once you run the parsim command, the Simulation Manager UI
opens up as follows:

In the Figure 1 tab, you can view the default scatter
plot where the parameter Cf is plotted against itself. Use
the Plot Properties to edit the plot. Add grid lines for
X and Y by checking the corresponding
boxes. You can also change the data that is displayed on X- and Y- axes and the
Marker Color. Change the data on y-axis by selecting
ScopeData(1) from the Data
drop-down. Set the Marker Color Data field to
RunID.
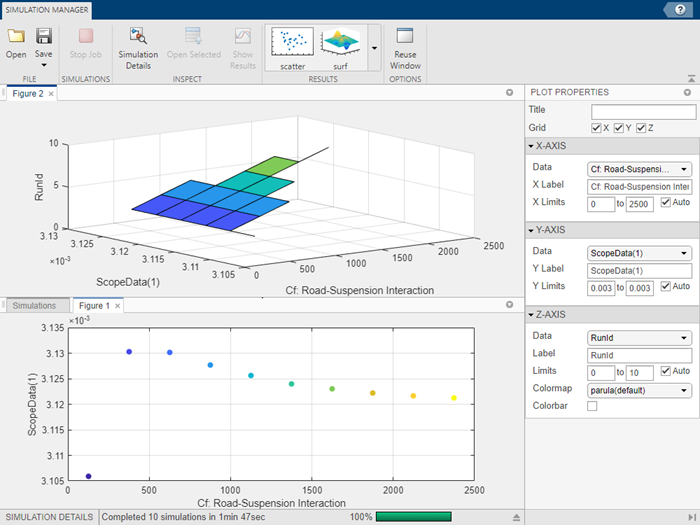
To add another figure to the Simulation Manager, click surf or scatter plot and add plots as desired. In this example, click surf plot, located in the Results section of the toolstrip. Drag the Figure 2 tab to view the two plots together.
Plots in the Simulation Manager support numeric arrays and datasets.

Adding multiple plots to the Simulation Manager enables you to observe the simulation data in different ways. Using the results, you can analyze and study the design space of the parameters and their behavior.
You can modify the configuration of the plot layouts by clicking the down arrow on the right corner of the plot.

Tile All — Choose a layout for multiple plots.
Tab Position — Select where to display the figure tab.
To view the status of the simulations in list and grid views, click the Simulations tab next to Figure 1. Toggle between the List and Grid in the Views section of the toolstrip. The list view shows a tabular view of the simulations with certain details, such as status, parameters and timing information. For large number of simulations, choose grid view for a compact view of the status of the simulations.

The status bar at the bottom of the window shows the progress of the simulations.
You can view all the multiple simulations in a detailed list view. This view
gives you an option to add or delete columns. Use the ![]() button to choose which columns to display.
You can also sort the columns based on your preference.
button to choose which columns to display.
You can also sort the columns based on your preference.
Click a specific run to view more details about it.. The simulation details appear at the bottom of the window.
To show or hide the details of the selected simulation, toggle the Simulation Details button,
![]() .
.
Open Selected button,
![]() , allows you to open the model with the
specifications of the selected run.
, allows you to open the model with the
specifications of the selected run.
You can view the results of one or more runs in the Simulation
Data Inspector by clicking the Show
Results button, ![]() . Clicking Show Results
creates a Simulation Data Inspector run from the
. Clicking Show Results
creates a Simulation Data Inspector run from the
Simulink.SimulationOutput object and is displayed in
Simulation Data Inspector.
To abort the job while the simulations are running, you can use the Stop Job button, ![]() .
.
To save the Simulation Manager session, click the Save
button on the toolstrip. The saved session contains all the simulation data and
the plot configurations and layout. To reopen the saved Simulation Manager
session, navigate to the folder where the file is saved and double-click the
.mldatx Simulation Manager file.
The Reuse Window, ![]() , button enables you to reuse the plot layout
and configurations for new multiple simulations run with a different set of
data. If the button is toggled off, a new window opens with each set of
simulations. If the button is toggled on, the new simulations reuse the existing
window preserving all plot configurations and layouts.
, button enables you to reuse the plot layout
and configurations for new multiple simulations run with a different set of
data. If the button is toggled off, a new window opens with each set of
simulations. If the button is toggled on, the new simulations reuse the existing
window preserving all plot configurations and layouts.
To reopen a saved file, use the Open button, navigate to the file location and double click the file.

