GPU Performance Analyzer
GPU Performance Analyzer
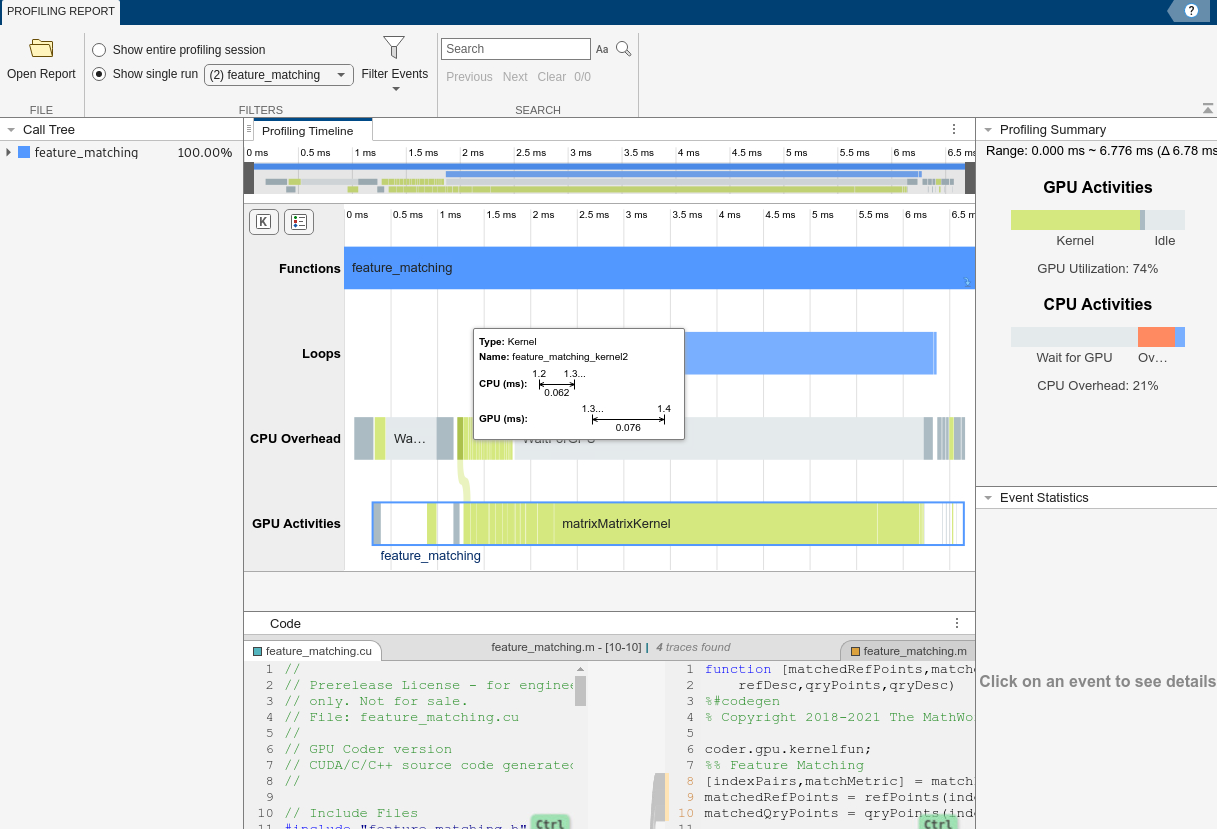
The GPU Performance Analyzer exposes GPU and CPU activities, events, and performance metrics in a chronological timeline plot to visualize, identify and address performance bottlenecks in the generated CUDA® code.

These numbers are representative. The actual values depend on your hardware setup.
Profiling Timeline
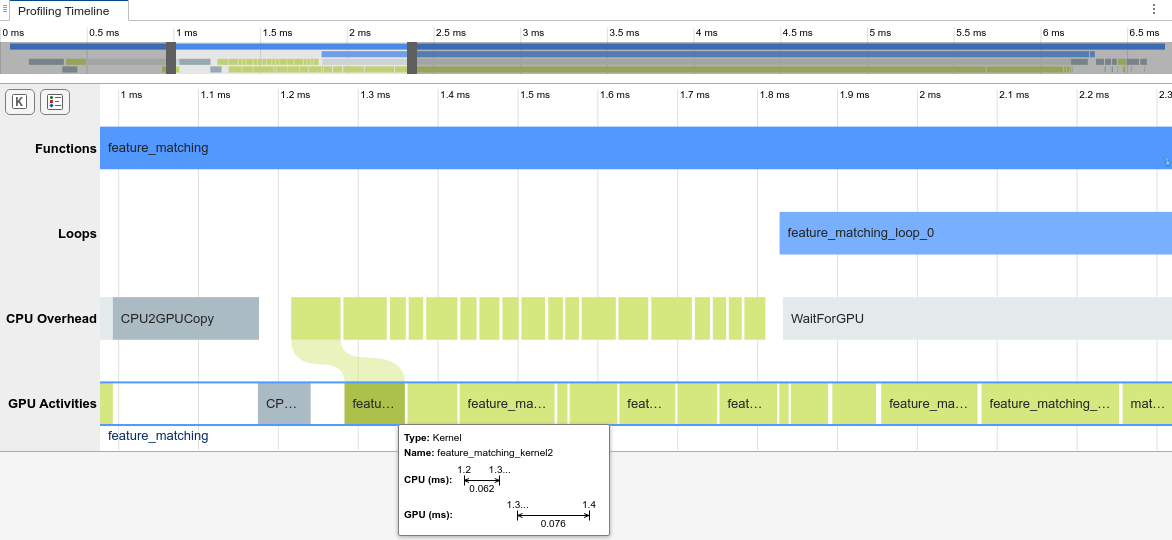
The profiling timeline shows the complete trace of all events that have a runtime higher than the threshold value. A snippet of the profiling trace is shown.

You can use the mouse wheel (or an equivalent touch pad option) to zoom into and out of the timeline. Alternatively, you can use the timeline summary at the top of the panel to zoom and navigate the timeline plot.
The tooltips on each event indicate the start time, end time and duration of the selected event on the CPU and the GPU. It also indicates the time elapsed between the kernel launch on the CPU and the actual execution of the kernel on the GPU.
By default, in the toolstrip tab Filters, the Show single run radio button is selected and the associated drop-down menu is set to the last iteration of the generated code. To see profiling data for a previous iteration, select that run in the drop-down menu. To view profiling data for the entire application including initialization and termination, select the Show entire profiling session radio button.
On the Functions and Loops rows, you can navigate between caller and callee functions/loops using the up/down arrows that appear on the right side of the event bar.
Insights
The Insights panel gives a pie chart overview of the GPU and CPU activities. The pie chart changes according to the zoom level of the profiling timeline. A snippet of the insights panel is shown. Within the region selected on the timeline, it shows that the GPU utilization is 77%.

The event statistics section of the Insights panel shows
additional information for the selected event. For example, the
feature_matching_kernel2 shows the following statistics:

Call Tree
This section lists the GPU events called from the CPU. Each event in the call tree lists the execution times as percentages of caller function. This metric can help you to identify performance bottlenecks in generated code. You can also navigate to specific events on the profiling timeline by clicking on the corresponding events in the call tree.
File
Use Open Report to open a GPU profiling report
(gpuProfiler.mldatx). By default, the
gpuPerformanceAnalyzer function generates files in the following
location:
codegen/target/fcn_name/html
target can be:
mexfor CUDA MEXlibfor CUDA librariesdllfor CUDA dynamic libraries
fcn_name is the name of the MATLAB® entry-point function.
Note
Each time gpuPerformanceAnalyzer generates the same type of
output for the same code, it removes the files from the previous build. If you want to
preserve files from a previous build, before starting another build, copy them to a
different location.
Filters
This section provides filtering options for the report.
Show entire profiling session - Use this option to view profiling results for the entire application including initialization and termination.
Show single run - Use this option to view profiling results for a single iteration of the generated code.
Under Filter Events:
Threshold (ms) - Skip events shorter than the given threshold.
Memory Allocation/Free - Show GPU device memory allocation and deallocation related events on the CPU activities bar.
Memory Transfer - Show host-to-device and device-to-host memory transfers.
Kernel - Show CPU kernel launches and GPU kernel activities.
Other Event - Show other GPU related events such as synchronization and waiting for GPU.
Limitations
GPU Performance Analyzer has been tested with Nsight 2022.5.1. Other versions of Nsight Systems may require admin privileges on Windows® platforms.
On the Functions and Loops rows, you can navigate between caller and callee functions/loops using the up/down arrows that appear on the right side of the event bar. For short events, it may not be possible to navigate back to the calling function/loop by using the up/down arrows. In such cases, use the call tree to navigate to the calling/callee functions/loops
GPU Performance Analyzer displays the row header even if the row does not contain a event.
At low zoom levels, GPU Performance Analyzer represents a densely populated area of short events separated by short distances as a single event. At higher levels of zoom, GPU Performance Analyzer displays the actual events. However, if the event duration is extremely short, it may not be possible to render this event on the timeline plot, even at high zoom levels.
GPU Performance Analyzer uses a single row to represent all the GPU events. In case of multiple CUDA streams, the GPU Activities row may contain overlapping events and the occupancy calculation in the Insights panel may be inaccurate. For example, deep learning libraries such as cuDNN may use multiple CUDA streams.
See Also
Functions
Objects
Related Examples
- Analyze Performance of Generated CUDA Code
- GPU Profiling on NVIDIA Jetson Platforms
- Analyze Performance of Code Generated for Deep Learning Networks
