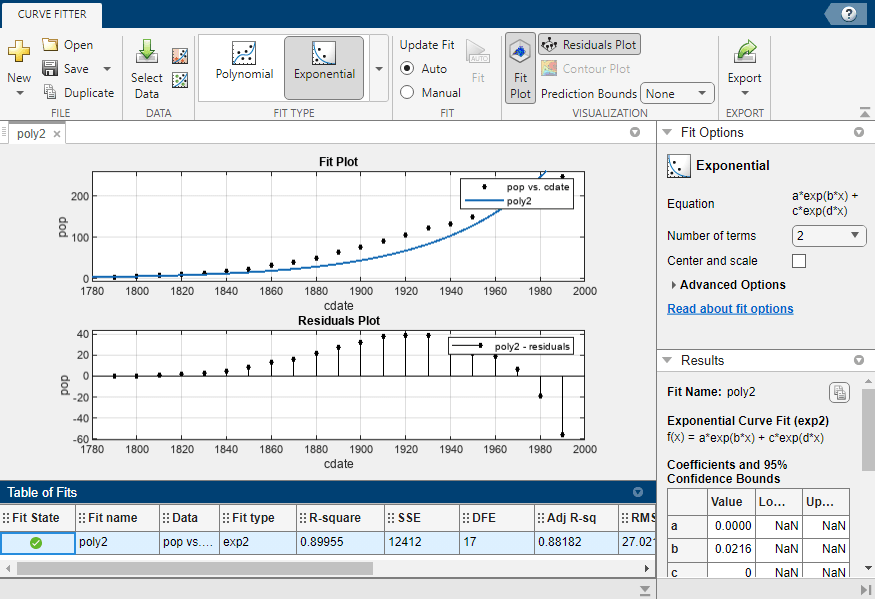
Curve Fitter
Fit curves and surfaces to data
Description
The Curve Fitter app provides a low-code interface where you can interactively fit curves and surfaces to data and view plots.
With the Curve Fitter app, you can:
Create, plot, and compare multiple fits.
Use linear or nonlinear regression, interpolation, smoothing, and custom equations.
View goodness-of-fit statistics, display confidence intervals and residuals, remove outliers, and assess fits with validation data.
Automatically generate code to fit and plot curves and surfaces, or export fits to the workspace for further analysis.
Export a curve or surface fit to a Simulink® lookup table. For an example, see Export Fit from Curve Fitter App to Simulink Lookup Table.
Open the Curve Fitter App
MATLAB® Toolstrip: On the Apps tab, under Math, Statistics and Optimization, click the app icon.
MATLAB command prompt: Enter
curveFitter.
Examples
Programmatic Use
Tips
When selecting data for fitting curves or surfaces in Curve Fitter, you can specify to use table variables. On the Curve Fitter tab, in the Data section, click Select Data. The app opens a dialog box. For each data variable (X data, Y data, Z data, or Weights), first select the table name and then select the name of the column variable that you want to use.
You can also specify validation data using table variables. Click Validation Data in the Data section of the Curve Fitter tab to open the Select Validation Data dialog box.
To programmatically open the Curve Fitter app and create a curve fit to
xandy, wherexandyare variables in tabletbl, entercurveFitter(tbl.x,tbl.y)at the MATLAB command line. Similarly, entercurveFitter(tbl.x,tbl.y,tbl.z)to create a surface fit in the Curve Fitter app for the table variablesx,y, andz.

