Main Content

Code Profile Analyzer

Analyze execution-time and stack usage profiles for generated code

Since R2023a

Description

Use the Code Profile Analyzer to analyze execution-time and stack usage profiles produced by software-in-the-loop (SIL) or processor-in-the-loop (PIL) execution of generated code:

  • View execution times of tasks and functions, visualize the function-call stack at a specific simulation time, and compare execution times from different runs.

  • View stack usage for tasks and functions and compare values from different runs.

You can also:

  • Analyze execution-time profiles produced by XCP-based external mode simulations.

  • Configure code profiling for a model hierarchy.

  • Identify and analyze performance hotspots in the generated code. This workflow uses the coder.profile.test.runTests function.

  • Identify and analyze critical paths in the generated code. This workflow uses the coder.profile.test.analyzePath function.

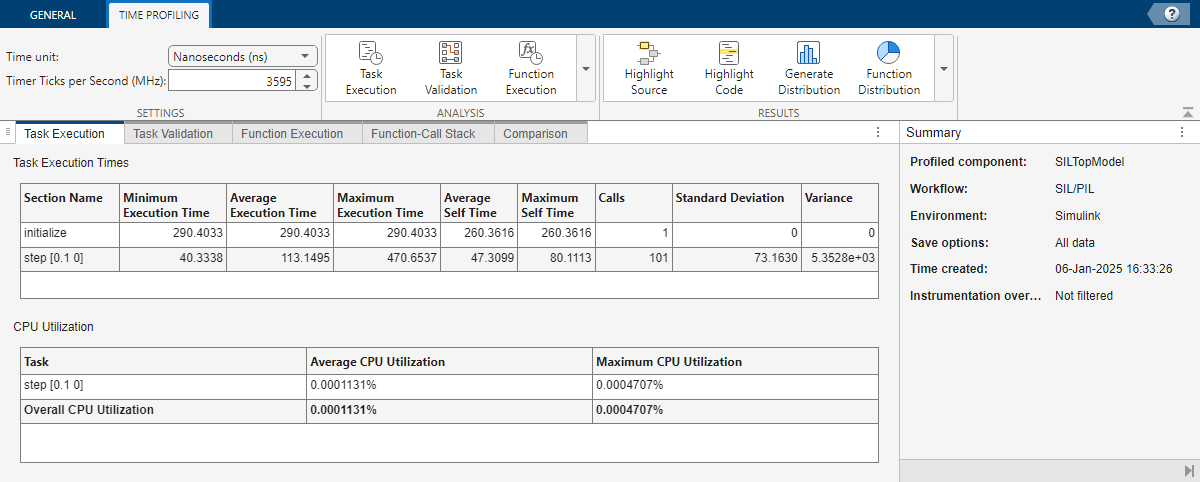
Code Profile Analyzer app

Open the Code Profile Analyzer App

If you are generating code for a Simulink® model, click the SIL/PIL tab. In the Results gallery, under Execution Profiling Results or Stack Profiling Results, click the Code Profile Analyzer button.

If you are generating code for MATLAB® code, terminate the SIL/PIL execution in the Command Window or in the Test Output tab in the MATLAB Coder™ app. The code generator produces a message in the Command Window that contains a link to the execution or stack profiling report. Click that link.

Alternatively, for both Simulink and MATLAB code generation, open the Code Profile Analyzer from the Command Window after the SIL/PIL execution has been terminated by entering coder.profile.show or coder.profile.show(profileVariable).

For Simulink code generation, profileVariable is a workspace variable that you specify through the Workspace variable (CodeExecutionProfileVariable) or Stack workspace variable (CodeStackProfileVariable) configuration parameter.

For MATLAB code generation, obtain profileVariable by using the getCoderExecutionProfile or getCoderStackProfile function.

Examples

expand all

This workflow shows the steps you might use when analyzing execution-time metrics with the Code Profile Analyzer.

  1. Open the Code Profile Analyzer.

  2. In the Import section, from the Import Results drop-down list, select the Time Profiling workspace variable that contains your execution-time measurements.

  3. In the Settings section, specify values for:

    • Time unit — Unit for displayed time measurements

    • CPU Clock (Hz) — CPU frequency for analysis

  4. To perform an execution-time analysis, in the Analysis section, click one of these buttons:

    • Task Execution — Analyze task execution times.

    • Function Execution — Analyze task and function execution times.

    • Function-Call Stack — Visualize the function-call stack at a specific simulation time

    • Comparison — Compare execution times from two simulations

  5. Select a code section (a task or function), and then, in the Results section, click one of these buttons:

    • Highlight Source — In the Simulink model, show the block associated with the code section.

    • Highlight Code — In the generated code, show the call to the code section.

    • Generate Distribution — Display the execution-time distribution for the code section.

    • Function Distribution — Display pie charts that show the relative execution times of the caller and called functions in the generated code.

    • Export to SDI — Display the measured execution times in the Simulation Data Inspector.

  6. For the overall simulation, use the Results section to:

    • Highlight Profiling — Color model components that are profiled.

    • Open Report — Open the code execution profiling report.

    • Generate Schedule — Visualize task scheduling.

For more information, see View and Compare Code Execution Times.

This workflow shows the steps you might use when analyzing stack usage metrics with the Code Profile Analyzer.

  1. Open the Code Profile Analyzer.

  2. In the Import section, from the Import Results drop-down list, select a Memory Profiling workspace variable that contains your stack usage measurements.

  3. To perform a stack usage analysis, in the Analysis section, click one of these buttons:

    • Stack Memory — Analyze stack usage of tasks and functions

    • Comparison — Compare stack usage measurements from two simulations

  4. Select a code section (a task or function), and then, in the Results section, click one of these buttons:

    • Highlight Code — Show call to code section in generated code.

    • Generate Distribution — Display execution memory distribution for code section.

    • Export to SDI — Display stack usage values in Simulation Data Inspector.

  5. For the overall simulation, use the Results section to:

    • Open Model — Open the source model.

    • Open Report — Open the code stack profiling report.

For more information, see Stack Usage Profiling for Code Generated from Simulink Models.

To configure code profiling for a model hierarchy:

  1. Open the Code Profile Analyzer.

  2. On the General tab, click the Configure Models button.

  3. On the Configure tab, in the Load section, use the file browser or Open Top Model drop-down list to select a top model for configuration.

  4. To enable stack usage profiling, in the Configure section, click the Stack Usage Profiling button.

    Or, to enable execution-time profiling, in the Configure section:

    1. Click the Execution Time Profiling button.

    2. If you want to reduce the data that is saved to the MATLAB workspace, click the All data button and then select Summary data only or Metrics only.

    3. To control function profiling for models in the hierarchy, in the Model Settings view, use the the Function Profiling column settings, off, coarse, or detailed.

  5. To view a model in the Simulink editor:

    1. In the Model Hierarchy or Model Settings view, select the model.

    2. In the Validate section of the toolstrip, click the Highlight Model button.

  6. To check that the profiling settings across the hierarchy are valid, click the Validate Configuration button.

  7. To save profiling settings for models in the hierarchy, click the Apply Configuration button.

Related Examples

Version History

Introduced in R2023a